
Sales and Customer Dashboard
Apr 14, 2025
Marketing Analytics
Project Description
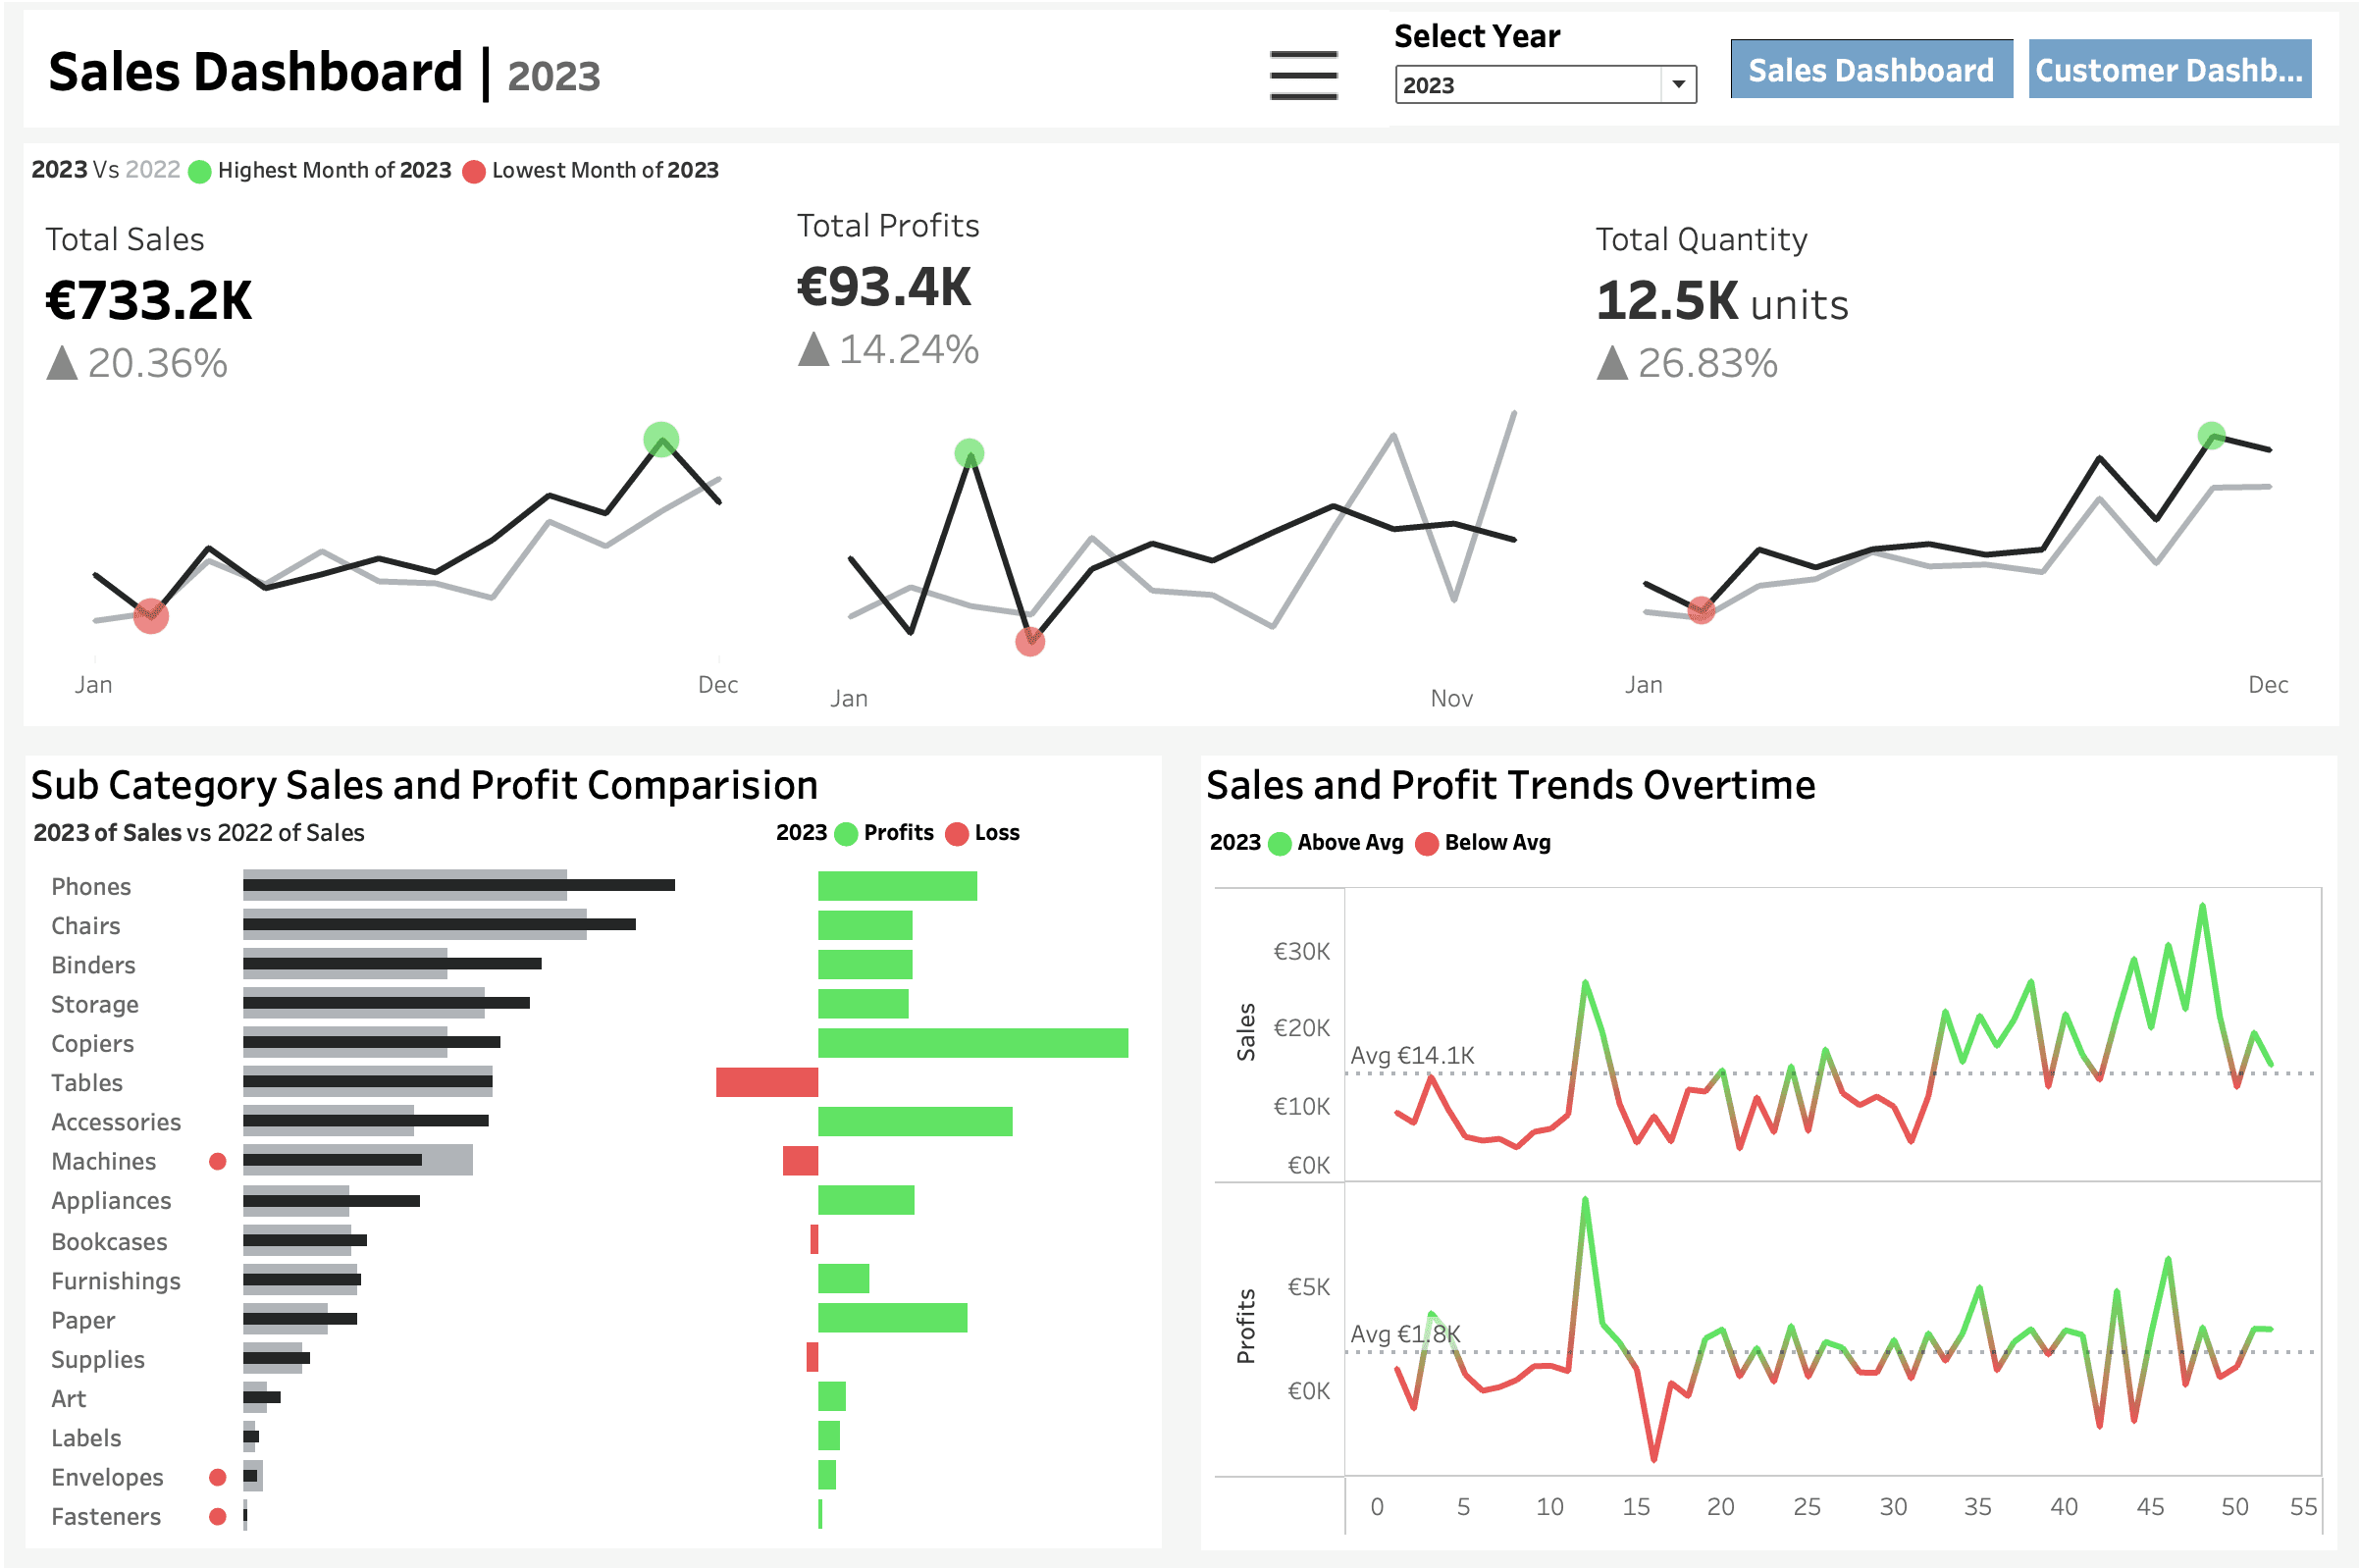
This project presents an interactive Sales and Customer Dashboard, developed in Tableau to provide deep visibility into customer dynamics, sales performance, and regional business trends. The goal was to empower business leaders with real-time insights for strategic planning and execution.
The dashboard integrates key performance indicators across multiple dimensions, including total sales, customer segments, product categories, and geographical regions. By using rich visualizations and drill-down capabilities, it supports granular analysis of customer behavior and sales trends — leading to more informed, data-driven decisions.
Introduction
Understanding who your customers are, where they come from, and what they buy is critical to business growth. This project aimed to build a comprehensive dashboard that not only presents high-level performance metrics but also enables deeper exploration of sales and customer analytics.
Using Tableau, we visualized sales distribution, customer acquisition patterns, and product performance across various regions. The dashboard is equipped with interactive filters, charts, and heatmaps — helping stakeholders answer questions like:
• Which customer segments generate the most revenue?
• What regions have the highest sales volume?
• How do product categories perform across time?
Key Stats & Insights
1. Total Revenue Generated: $2.3 Million
• The dashboard captured overall revenue trends, highlighting a 15% increase in Q4 compared to Q3, driven by a spike in new customer acquisitions.
2. Top Performing Region: East Zone (32% of Total Sales)
• Regional breakdown showed that the East Zone consistently outperformed others, indicating strong market penetration and customer loyalty in that area.
3. Customer Segment Insight:
• Corporate Customers contributed the highest revenue share (over 40%), followed by Small Business customers.
• New customers accounted for 25% of Q4 revenue, signaling effective lead conversion strategies.
4. Best-Selling Product Category: Technology
• Technology products made up 48% of total sales, with laptops and networking devices being the most in-demand items.
5. Repeat Purchase Rate: 62%
• The dashboard tracked returning customer behavior, revealing strong customer satisfaction and loyalty among existing clients.
6. Seasonal Trends Identified:
• Sales peaked in November and December, correlating with promotional campaigns and year-end discounts — a clear indication of seasonal buying behavior.
Key Learnings
1. Visual Analytics Accelerate Decision-Making:
Clear, interactive visuals helped stakeholders pinpoint issues and opportunities within seconds — from underperforming products to high-growth customer segments.
2. Customer Behavior is Data-Driven:
Customer segmentation by category and region revealed actionable insights, enabling more targeted marketing and personalized sales approaches.
3. Product Strategy Must Align with Regional Demand:
Regional sales variations highlighted the importance of localized inventory and campaign strategies.
4. Retention is as Crucial as Acquisition:
With a 62% repeat purchase rate, the focus shifts to enhancing customer experience and upselling opportunities.
5. Sales Forecasting is More Accurate with Trend Analysis:
Seasonality patterns and time-series visualizations support more precise demand forecasting and campaign timing.
A hyperlink is attached below to view the Dashboard Online.
Sales and Customer Dashboard
Apr 14, 2025
Marketing Analytics
Project Description
This project presents an interactive Sales and Customer Dashboard, developed in Tableau to provide deep visibility into customer dynamics, sales performance, and regional business trends. The goal was to empower business leaders with real-time insights for strategic planning and execution.
The dashboard integrates key performance indicators across multiple dimensions, including total sales, customer segments, product categories, and geographical regions. By using rich visualizations and drill-down capabilities, it supports granular analysis of customer behavior and sales trends — leading to more informed, data-driven decisions.
Introduction
Understanding who your customers are, where they come from, and what they buy is critical to business growth. This project aimed to build a comprehensive dashboard that not only presents high-level performance metrics but also enables deeper exploration of sales and customer analytics.
Using Tableau, we visualized sales distribution, customer acquisition patterns, and product performance across various regions. The dashboard is equipped with interactive filters, charts, and heatmaps — helping stakeholders answer questions like:
• Which customer segments generate the most revenue?
• What regions have the highest sales volume?
• How do product categories perform across time?
Key Stats & Insights
1. Total Revenue Generated: $2.3 Million
• The dashboard captured overall revenue trends, highlighting a 15% increase in Q4 compared to Q3, driven by a spike in new customer acquisitions.
2. Top Performing Region: East Zone (32% of Total Sales)
• Regional breakdown showed that the East Zone consistently outperformed others, indicating strong market penetration and customer loyalty in that area.
3. Customer Segment Insight:
• Corporate Customers contributed the highest revenue share (over 40%), followed by Small Business customers.
• New customers accounted for 25% of Q4 revenue, signaling effective lead conversion strategies.
4. Best-Selling Product Category: Technology
• Technology products made up 48% of total sales, with laptops and networking devices being the most in-demand items.
5. Repeat Purchase Rate: 62%
• The dashboard tracked returning customer behavior, revealing strong customer satisfaction and loyalty among existing clients.
6. Seasonal Trends Identified:
• Sales peaked in November and December, correlating with promotional campaigns and year-end discounts — a clear indication of seasonal buying behavior.
Key Learnings
1. Visual Analytics Accelerate Decision-Making:
Clear, interactive visuals helped stakeholders pinpoint issues and opportunities within seconds — from underperforming products to high-growth customer segments.
2. Customer Behavior is Data-Driven:
Customer segmentation by category and region revealed actionable insights, enabling more targeted marketing and personalized sales approaches.
3. Product Strategy Must Align with Regional Demand:
Regional sales variations highlighted the importance of localized inventory and campaign strategies.
4. Retention is as Crucial as Acquisition:
With a 62% repeat purchase rate, the focus shifts to enhancing customer experience and upselling opportunities.
5. Sales Forecasting is More Accurate with Trend Analysis:
Seasonality patterns and time-series visualizations support more precise demand forecasting and campaign timing.
A hyperlink is attached below to view the Dashboard Online.
Let’s work together, to bring the
light to your brand.
Let’s work together, to bring the
light to your brand.
Let’s work together, to bring the light to your brand